Blog
An intrapreneurship program generates a wealth of data: ideas submitted, employees engaged, projects supported… But the easiest metrics to collect aren't necessarily the ones that reveal whether a program is delivering lasting value.
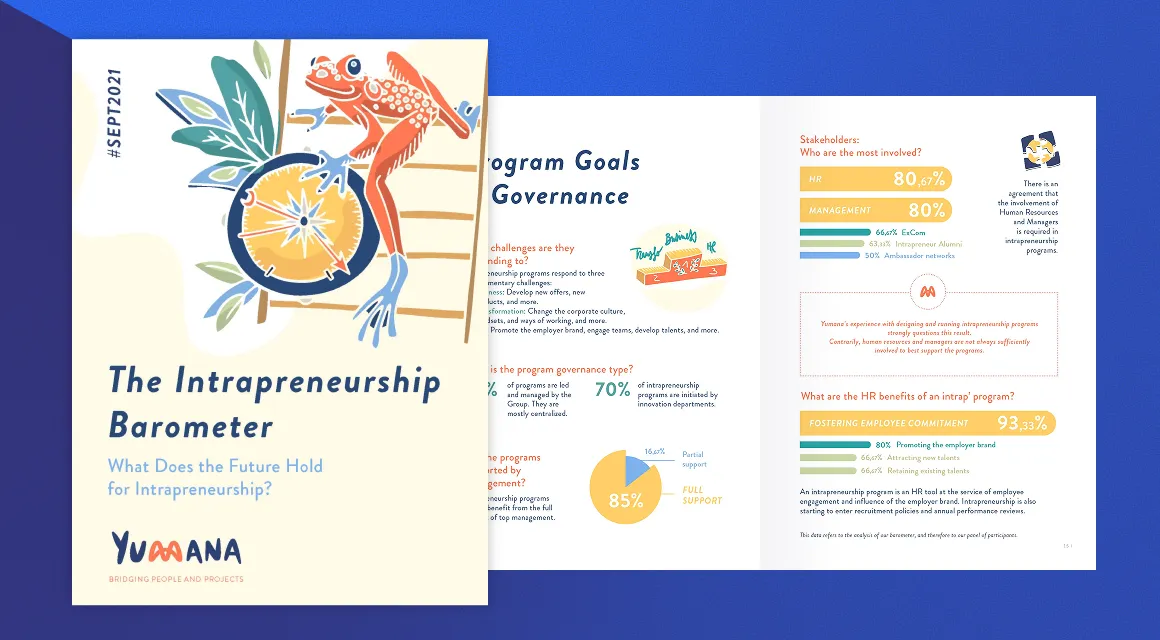
For many companies, performance measurement remains a work in progress: according to Yumana's Intrapreneurship Barometer, only 39% of companies have set measurable objectives for their programs.
A good dashboard needs to capture several dimensions at once: Is the program engaging employees? Is it turning ideas into viable projects? Are those projects creating business value? And what does the experience bring to the employees involved?
Here are 12 KPIs to track these four dimensions together and strengthen your program's impact from one cohort to the next.
Source : Yumana Intrapreneurship Barometer 2025
110 companies surveyed, from 1,500 innovation leaders contacted across Europe.

Employee Engagement Metrics
Participation rate
What percentage of eligible employees actually take part in the program?
The participation rate measures a program's ability to engage employees. It's particularly useful when tracked from one cohort to the next.
However, it must always be assessed in relation to the program's scope: an innovation challenge open to the entire Group will naturally attract different participation volumes than a targeted call for ideas focused on specific business functions or areas of expertise.
Business Unit and Function Coverage
A program can achieve an excellent participation rate while consistently engaging the same groups of employees.
Tracking participation across business units, subsidiaries, countries, and functions helps reveal how widely the program is reaching across the organization and identify areas where engagement remains limited.
It's also a useful indicator of program maturity, particularly as the initiative moves beyond its initial community of innovation enthusiasts.
Active Engagement Rate
Beyond participation numbers, this metric looks at how actively employees contribute: submitting ideas, voting, commenting, evaluating projects, attending group sessions, and bringing their expertise to project teams.
It can be tracked during idea sourcing and community engagement activities, then throughout project development, as teams connect with experts, mentors, sponsors, and contributors through matchmaking.
This is where engagement becomes particularly meaningful: employees are no longer simply participating, but actively helping projects move forward.
Over time, a strong program should extend its reach beyond the intrapreneurs themselves.
Project Pipeline Metrics
Idea-to-Project Conversion Rate
How many submitted ideas or applications actually become projects selected for support?
This rate measures how effectively idea sourcing generates a qualified project pipeline. It should be tracked at each selection stage, but interpreted in light of the sourcing approach.
A broad call for ideas may intentionally generate a large volume of submissions while selecting only a small proportion. Targeted sourcing, on the other hand, will naturally result in a higher conversion rate.
There is no universal ideal conversion rate. What matters is whether the level of selectivity aligns with the sourcing approach.
Project-to-Deployment Conversion Rate
Further along the journey, this KPI measures the proportion of supported projects that reach implementation, whether through deployment, integration into a business unit, acceleration, or another outcome defined by the program.
It needs to be assessed over a realistic timeframe. Comparing projects that completed incubation three months ago with initiatives requiring two years of development would distort the results.
Time-to-market provides a complementary perspective: how long does it take to move from selection to prototype, from experimentation to decision, and from decision to deployment? Tracking these intervals helps identify where projects are actually slowing down.
Project Discontinuation Rate
A high project discontinuation rate isn't necessarily a sign that a program is underperforming. Intrapreneurship also means knowing when to stop investing resources in projects whose potential hasn't been demonstrated.
Tracking how many projects are discontinued, at what stage, and for what reasons reveals how effectively the program makes decisions about which initiatives to pursue.
A zero discontinuation rate can even be a warning sign if projects keep moving forward simply because no clear decisions are being made.
A well-documented decision to stop a project is also a valuable portfolio management decision.
Business Value Metrics
Business Value Generated
As projects mature, performance measurement increasingly focuses on the tangible economic value they generate: revenue, cost savings, avoided costs, and other financial gains.
This KPI is therefore most relevant when tracked annually or over several years.
Some programs may also distinguish between the value generated within the core business and that created through new growth opportunities.
Value Target Achievement Rate
Not all projects aim to achieve the same outcomes. Some focus on generating revenue, others on reducing costs, acquiring new customers, improving operations, or validating a market opportunity. It is therefore important to compare actual results against the value objectives each project was designed to achieve.
This KPI helps revisit the targets set at the outset and track how they evolve through experimentation and lessons learned.
It becomes even more meaningful when assessed alongside the resources invested.
Business Unit Ownership Rate
A project can successfully complete every stage of an intrapreneurship program and still go nowhere if no business unit takes ownership of what comes next.
The business unit handover rate measures the proportion of projects reaching the transfer stage that have a designated owner, allocated resources, a budget, or clearly assigned responsibility for taking them forward.
The goal is to assess how well projects are positioned to succeed beyond the program.
Employee Impact Metrics
Skills Progression Rate
Intrapreneurship exposes employees to challenges they rarely encounter in their day-to-day roles: experimentation, understanding user needs, business model development, pitching, influencing without formal authority, cross-functional collaboration, and managing uncertainty.
Skills development can be assessed through before-and-after evaluations, the identification of newly acquired competencies, badges, or formal certifications.
This metric becomes particularly valuable when the results feed into HR competency frameworks, talent reviews, career development plans, and internal mobility opportunities.
Intrapreneur Retention Rate
What happens to employees after their intrapreneurship experience?
Tracking retention at 12 or 24 months helps assess how effectively the program retains participating talent. Where possible, these results should be compared with those of a similar employee population within the organization to provide meaningful context.
But retention alone doesn't tell the whole story. Internal mobility, new responsibilities, and participation in new projects also help reveal how the experience has shaped an employee's career path.
Program NPS
Program NPS measures how likely participants are to recommend the intrapreneurship experience to other employees. It should not be confused with eNPS, which measures employees' willingness to recommend their company as an employer.
Measured at the end of the program, it provides insight into the quality of the participant experience. Reassessing it a few months later helps determine whether that positive perception lasts once employees have returned to their usual working environment.
The 12 KPIs at a Glance
Measuring Performance to Demonstrate Value
The gap between ambition and measurement remains significant: 89% of programs surveyed by Yumana aim to address business challenges, yet only 39% of companies have set measurable objectives.
This is where a dedicated platform makes a difference. It brings together data collected throughout the program, maintains a record of projects and decisions, and makes it possible to compare cohorts over time.
This historical perspective becomes increasingly valuable as programs mature: 65% of programs running for more than five years use a dedicated collaborative platform, compared with 55% overall.
Their ability to discontinue low-value projects also improves, rising from 5.5/10 for programs less than three years old to 7.1/10 for older programs, and reaching 7.6/10 among programs over three years old that use a collaborative platform.
As the project portfolio grows, the right tools help teams make better-informed decisions and turn these improvements into lasting organizational capabilities.
Building Your Dashboard: Fewer Metrics, Better Decisions
These 12 KPIs provide a set of indicators to choose from and interpret based on the program's launch timeline, ambitions, maturity, and the stage each project has reached.
An early-stage innovation challenge will focus more on participation, organizational reach, and active engagement. An incubation program will prioritize project progression, go/no-go decisions, and the transition to deployment.
As the program matures, business unit adoption, economic value, and talent development become increasingly important.
There is no universal ideal conversion rate or number of ideas. A KPI only makes sense in relation to what the program is designed to achieve, and becomes more valuable when tracked over time.
By building a consistent record from one cohort to the next, organizations can identify trends and make increasingly informed decisions about how to manage and improve their programs.

CTO & Co-Founder